Awareness of Geography and Statistics
Course Summary
Introduction
This short course provides an overview of why geography matters for statistics.
It will give an introduction to what you need to know to unlock the geography in your data and where to get help if you get stuck.
Estimated time for course
1 hour
Audience
Those managing work which incorporates aspects of geography
Course Aims
This course covers:
- Why geography matters for statistics
- How to use geography correctly
- Understanding geographic data
- Introducing Geographic Information Systems (GIS) and geospatial techniques
Location Matters
Introduction
Everything happens somewhere
Every time we receive a response to a survey, knock on a door or receive data from a supplier there is location associated with that data. In some cases the data is for single address or businesses – in others it relates to a Postcode, a Ward or a Local Authority or one of a whole range of other geographies that we will cover later.
Most times when we produce statistics they are also about places – sometimes the whole country but often for Local Authorities, health areas or much smaller geographies such as Wards or the Output Areas associated with Census.
Three key reasons that geography matters
- Geography is fundamental to the way we produce statistics - if we don’t get the geography right there is real risk that we will damage the quality of our statistics.
- As we pull more data together in ONS, geography provides a great way to integrate between topics and across themes – often location will be the only element that disparate datasets hold in common.
- Spatial relationships matter and there is a wealth of well established and emerging spatial tools available to help us lever more information out of our data.
The importance of Geography in Statistics
Getting the geography right is critical throughout the statistical production journey.
Datasets from Ordnance Survey and other data providers help form fundamental ONS products such as address and postcode frames used to run surveys and spines of reference data which link and locate administrative sources.
At ONS, geography experts in Data Architecture maintain key reference datasets such as the Address and Business indexes, look-up tables which allow referencing between different types of geography, and names and code lists used to reference our outputs. By linking the data we collect to these frames and cutting the data using look-ups and boundary sets it is possible to produce statistics.
Geographic tools allow this production, as well as helping us analyse the data and provide access via the website. Get any of this wrong and the statistics will be wrong.
The great integrator
Location is a great way of integrating disparate datasets – it is universal and common to almost all ONS and public sector data. The location in our data therefore provides a powerful way of integrating across topics – social, economic and environmental themes for example.
As we add more administrative data, big-data and other sources to our data stores location can form an invaluable frame, bringing topics together for the first time.
[Spatial data is] “the connective tissue of open data” Sir Nigel Shadbolt
Spatial tools – GIS and Geospatial analysis
Mapping and visualisation of spatial data, both for analytical purposes and to enhance our web products, can significantly improve the understanding and accessibility of our statistics. The use of Geographic Information Systems (GIS) enables us to manage, analyse, and interpret data more effectively. By examining spatial patterns over time, and potentially in real time, we can uncover new insights and perspectives that were previously beyond reach.
The integration of spatial tools and data linkage also opens the door to more sophisticated analysis, extending far beyond our current capabilities. Increasingly, data from smart cars, connected infrastructure, and the ‘Internet of Things’ carry a geospatial dimension that will be essential for understanding the economy, the environment, and society in the years ahead. Geographic tools will play a vital role in managing these complex data sources and transforming them into meaningful insights.
Geography Policy
GSS Geography Policy
The Government Statistical Service (GSS) Geography Policy underpins the approach to geography across ONS and the GSS.
The policy outlines seven key pillars which underpin the best practice around using geography with statistics.

- Referencing: Reference source data at the lowest possible geographical level using x-y coordinates and/or standard identifiers.
- Naming and Coding: Use GSS Standard codes and names for attributing UK statistical geographies.
- Managing Change. Apply changes to geographies in a clear schedule and no less than once a year.
- Building Blocks: Build official statistics for any geography from the aggregation of whole statistical building blocks.
- Area Measurement: There are four types of area measurement provided, based on ‘flat’ measurements as represented on a map. The selected measurement should be tailored to the specific data under analysis.
- Classifications: Use the right type and currency of geographical classification for your statistical output.
- Presentation: Use standardised approaches and best practice for presenting geographies in tabular and machine-readable form and also when producing maps.
Key Geography Policies
As a user of geographic data from ONS, you should be particularly aware of the policies outlined below, which will directly impact your work.
Referencing Reference data, at source, at the lowest possible geographic level and using a standard identifier.
Naming and coding There are official codes and an approach for introducing new codes for all standard geographies. Use the official codes and avoid making up your own codes for geographic areas. Using official codes will cause less confusion and it will be easier to share data.
Presentation order When publishing lists of statistics for areas there are defined GSS guidelines outlining the order of areas. Generally, when entities are presented in groupings (e.g. districts within county, wards within district), the order of presentation at each level of the grouping hierarchy is alphabetic.
Standard area measurement For official statistics there are official areas calculated in hectares which should be used. When you want to include the area of a particular geographic area – say a Ward or District (for example if you want to calculate the population density) - use the standard area measurement, rather than the value calculated by your GIS.
Classifications There are a number of geographic classifications agreed for use across the GSS (and for the constituent nations of the UK) covering Urban/rural classification, area classifications, Workplace Zones etc. Use those rather than reinventing the wheel.
Geographic Data
Types of Geographic Data
Geographic data comes in two fundamental formats: vector and raster. Using these two formats we can represent any data with a location associated to it.
Vector Data
Vector data comes in three types:
- Points Individual locations which are represented by an X and Y coordinate. For example, addresses, the centre of a postcode, locations obtained from GPS.
- Lines A series of two or more connected points, for example, road network, rivers.
- Polygons A series of connected points which enclose a homogeneous area. For example, ONS boundary products like Lower layer Super Output Areas (LSOAs) or Local Authorities.
Image from Esri
In the statistical domain you will most often deal with vector data and within that, most commonly point or polygon types. Much of the data that ONS collects or uses is linked to a location, most commonly via a postcode or address, unique property reference number (UPRN) or GSS geography code. This allows us to link data together easily and accurately, and then produce statistics. We can think of postcodes, addresses and UPRNs as point data (pairs of XY coordinates); GSS geography codes allow us to link to the associated geographical boundaries, or polygons.
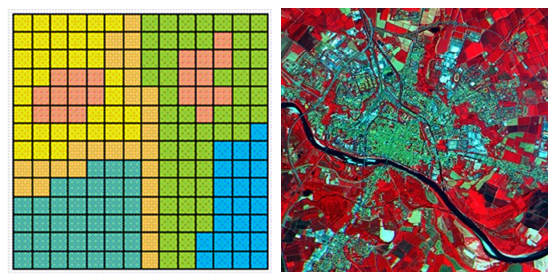
Rasters
Raster data is represented by a grid or equal sized cells, with a value for each cell. The most common example of raster data is an image and in the geographical context, this is often data collected by satellites, aerial imaging or data collected by drone (all often referred to as Earth observation data). Raster data is often large, and can need specialist tools to analyse properly.
Many types of environmental data are collected in raster format. In the statistical realm you are less likely to come across raster data, although there are applications for it, for example in work undertaken by Natural Capital and for the Sustainable Development Goals.
Look-ups and Code Lists
Look-ups and code lists provide the links between the different geographies that ONS produce, and the codes that relate to each geographic area. By allocating the correct codes to the data we collect, it is possible to use look-ups to aggregate data to other geographies.
The most commonly used look-ups at ONS link postcode or address to administrative areas (such as Wards, Parishes or Local Authorities). Other look-ups link between different types of areas (for example, between Output Areas and Parliamentary Constituencies or health areas). Some look-ups define how different units nest or relate to each other in a hierarchy.
Make sure you use the official codes wherever possible (rather than the names of areas) and link to the tables for the right date to avoid errors.
Working with Geographic Data
Georeferencing Data
Georeferencing data means providing it with an X and Y coordinate that identifies its position within a Coordinate Reference System (CRS). Put simply, a CRS is a way of representing positions on the Earth’s three-dimensional surface on a flat, two-dimensional map.
There are many different coordinate reference systems designed for use in different parts of the world. In Great Britain the CRS we use is the British National Grid, which is produced and maintained by Ordnance Survey, Great Britain’s Mapping Agency. If you’ve ever used an Ordnance Survey map for walking, cycling or perhaps back in geography class at school, you’ve used British National Grid, perhaps without even knowing it!
Sometimes the data we use is provided in a different CRS to British National Grid. This isn’t a problem as there are transformations that can be used to convert between systems. Most GIS software can also handle this automatically when viewing data, so you don’t usually need to worry about CRS differences for simple visualisation. However, be careful when analysing data in different coordinate reference systems, as using mismatched systems can lead to errors.
You can learn more about this in our Practical Geography for Statistics course. Remember, the Geospatial team are on hand to help, so please get in touch if you need support.
This is a very brief overview of locating geospatial data. In reality, geodesy is an incredibly complex field, which thankfully, you do not need to know too much more about at the moment!
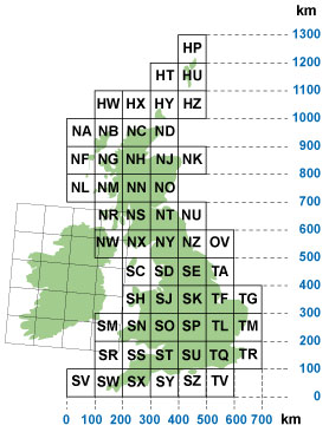
British National Grid: 100 km cells
GSS Names and Codes
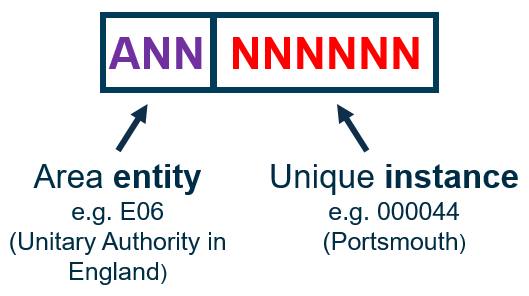
On 1st January 2011 GSS codes were introduced. GSS codes are a type of uniform resource indicator (URI) which provide a way to identify unique items. GSS codes identify individual geographic objects, for example, Local Authority Districts.
GSS codes are comprised of two parts: a three character entity code which describes what type of statistical geography the object is, and a six digit number which refers to the unique instance of the object.
The Register of Geographic Codes is the definitive list of all codes in use for UK statistical geographies. It should be used in conjunction with the Code History Database which charts historic changes in codes, which can be useful when understanding how statistical geographies have changed over time.
Referencing Areas Correctly
Referencing areas correctly is challenging, for example, there are several Newports across the country and hundreds of High Streets therefore, identifying one by name alone can introduce error. Even when you think you are referring to one clear location you could be describing different areas, for example, towns, wards and parishes may share a common name but cover completely different areas.
Using GSS codes to accurately refer to areas avoids problems. This is why referencing is one of the key pillars of the GSS Geography policy. Referencing by GSS codes also makes your life much easier as it simplifies joining statistics to areas.
Geographic Products from ONS
The Office for National Statistics (ONS) produces a wide range of geographic products used by many organisations and across diverse applications. The structure of UK geographies is inherently complex, designed to meet various analytical and operational needs.
Because administrative boundaries in the UK are subject to regular change, boundary datasets must be continually updated and maintained. It’s important to remain aware of these changes when producing statistics to ensure accuracy and consistency.
The ‘Hierarchical Representation of UK Statistical Geographies’ offers a clear overview of the different boundary types and how they relate to one another. This is a valuable reference resource, available through the Open Geography portal

Where to get data
There is a huge amount of geospatial data available on the internet. As with all data, you should carefully consider the provenance, accuracy and suitability of the data you source. You should also aim to use the authoritative sources of data wherever possible.
Geographic Data from ONS
ONS produces a range of geographic data, including boundaries, lookups, directories and classifications.
This data is available for download or access via API from the Open Geography Portal.

Geographic Data from Ordnance Survey
Ordnance Survey provide a wide variety of geospatial data which far exceeds the needs of most statisticians and analysts. Open data as well as premium data available to the Public Sector through the Public Sector Geospatial Agreement (PSGA) can be accessed via the Ordnance Survey Data Hub. We recommend following the excellent tutorials available in the Documentation to get started.
GIS and Analytical Techniques
In this section we will provide a quick overview of some of the basic techniques which can be used to start analysing spatial data.
Geographic Information Systems
A Geographic Information System (GIS) is a framework for storing, managing and analysing spatial data. When people think of GIS they usually think of a piece of software (for example, QGIS or ArcGIS), which is the way most people use GIS. However, you should also be aware that a GIS can take other forms like code or a cloud based database.
GIS can be used to bring together many different types of data and provides us with the tools to identify, analyse and understand patterns and relationships. GIS can also be a valuable tool in problem solving and decision making, as well as for investigation and visualisation.
Basic Spatial Analysis Techniques
This section will give you a quick overview of some of the most commonly used spatial techniques available in GIS, which can be combined to answer numerous questions around location.
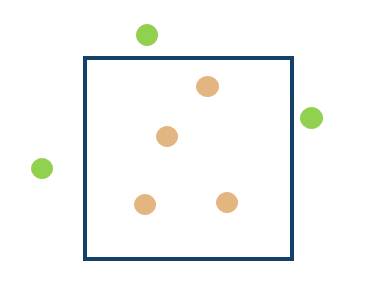
Select By Location allows you to select features based on their location relative to other features. In this example we have selected all the points which fall within the blue square; the selected points are in orange.
In this example, we have created a buffer and used the ‘Select By Location’ tool to select all addresses which fall within the buffer. We could use this method to find out how many homes are affected by flooding by selecting homes which fall within a flood boundary.

Buffer allows you to calculate a distance outward from an object.
In this example we have buffered the blue features. The resulting buffer is the green feature.
In this real-world example, buffers have been created around a point to 1,000 and 5,000 metre distances. By adding address points, it’s possible to calculate the number of households within these distances from a GP surgery, using ‘select by location’ to select the households which fall within each buffer.

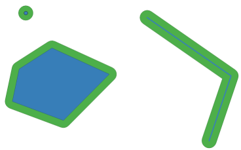
Point in Polygon is a way to join point and polygon feature attributes together, by joining points which fall within the polygon boundary. For example, this is frequently used to aggregate points to statistical geographies.
In this example we have joined the points to the greenspace areas they fall within.

Dissolve allows you to merge together polygons which overlap.
In this example the blue and green polygons have been dissolved into one object - the pink polygon.

Below, we can see the Unitary Authorities in Wales. In GIS software, you can combine multiple polygons into a single area by adding a field to the attribute table and giving each feature the same value. Using the Dissolve tool on that field will dissolve all features sharing that value into one continuous polygon.

Here we can see the result of the dissolve:

Clipping uses the extent of one geographic feature to trim another feature. For example, if you have a land use layer for the entire country, but were only interested in one region, you could clip the land use layer to the region boundary and would be left with land use for that region.
In this example we are only interested in greenspace areas in Wales and by running the clip tool we can remove all the greenspace areas outside of Wales.

Below is the result of using the Clip tool on the two datasets, the greenspace areas are now only present within Wales.

Merge combines two or more layers into a single layer. It’s different from dissolve as features which overlap are not combined into one feature but are kept as separate overlapping features.
In this example there are two separate vector layers, one for England and one for Wales. Each layer contains its own set of polygons and an attribute table. At the moment, these layers are stored separately and appear as distinct entries in the Layers panel.

When you run the merge tool on the England and Wales layers, the tool combines all features from both layers into a single dataset. It also merges the attribute tables, aligning fields with matching names and adding new columns where necessary. The result is one combined output layer:

More advanced spatial analysis techniques
The basic techniques outlined above can be easily utilised and have the power to provide great insights into statistical data. However, there are more complex techniques and data sources which can be used to provide more detail or statistical rigour to analyses. It is worth being aware of these techniques, although we would not expect you to be using them without more support or training.
Networks, drivetime and zoning can be used to solve problems relating to networks. One of the most commonly used networks is the road network, which allows you to answer questions like “how far is it to drive between these two points?”, “how far from this point can I travel in 30 minutes?” or “what areas can a field staff member cover in 1 hour of driving?”. Network analysis has been successfully used to plan field staff areas for the Census.
This map shows average travel time zones to a point on the South coast of England.

Cluster and Hotspot Analysis can be used to expose spatial groups or patterns which may not be visible to the human eye, particularly when dealing with large datasets. Statistical cluster analysis aims to classify or group objects into a number of different clusters, based on measured variables. This allows clustering of objects based on similarity (often in multiple dimensions) and location.
These methods can add statistical rigour to analysis, allowing us to express measures of statistical confidence based on the patterns or groups that are observed.
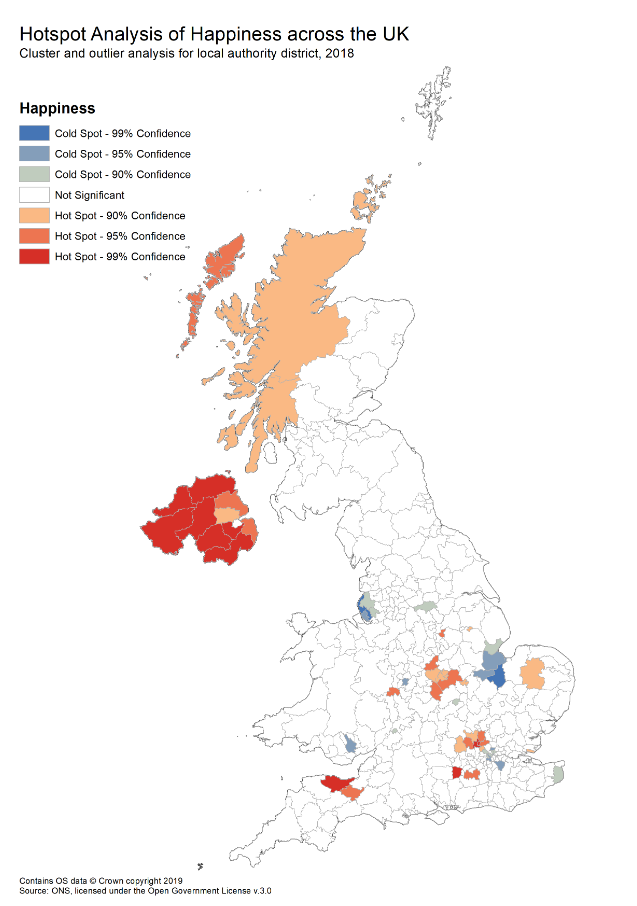
This map shows the results of hotspot analysis for happiness data from 2018. It shows significant clusters of high happiness (hotspots shown in red) and low happiness (cold spots shown in blue).
Earth observation and machine learning are often combined to analyse satellite data. Analysis of satellite data is a complex field that exists in its own right. So, for statistical applications, we tend to use data derived from satellite data to complement our analysis. For example, machine learning can be used to extract building outlines which can then be analysed using techniques outlined earlier.
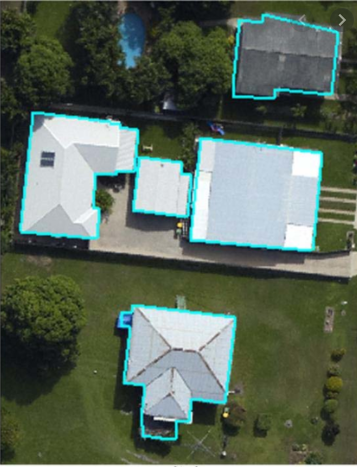
An example where machine learning has been used to extract building outlines from satellite data.
Mapping Your Data
Mapping data is one of the most basic but powerful things you can do with GIS. Maps can be used to present results, but also allow us to interrogate data sources or investigate relationships and patterns. It can also be a useful technique for spotting anomalies or problems during the quality assurance process.
Any GIS will give options for a number of different map types and a whole range of different symbologies and colours that allow you to bring your map to life. As with any visualisation, you need to think about the data you’re presenting and ensure you follow some simple rules. It is easy to lie or misdirect with a map if you make the wrong decisions. We outline how to make a good map in our course How to Make a Good Map.
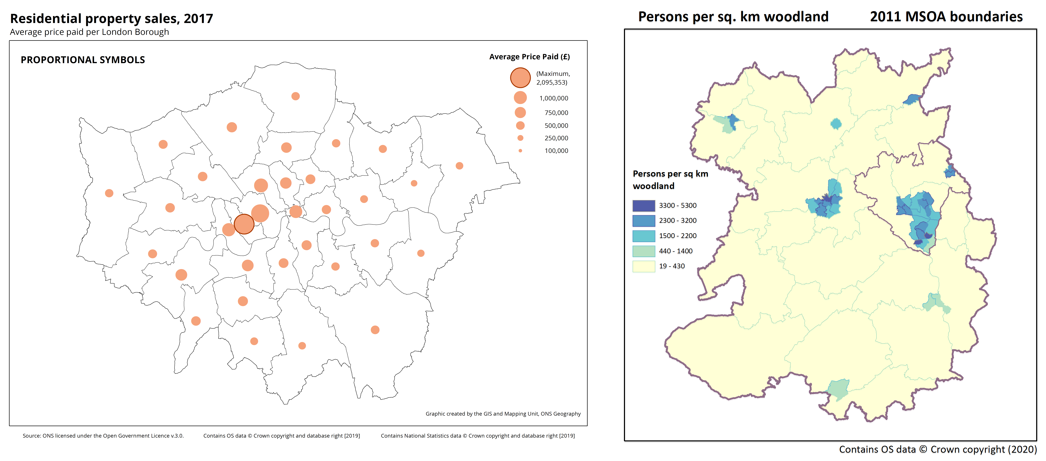
Examples of two commonly used map types: left - proportional symbol map and right - choropleth map.
Geospatial tools at ONS
If you work at ONS you are able to install geospatial software from the software centre (you may need to request it via the Service Desk first). We recommend the following tools:
QGIS is a desktop GIS tool which will allow you to quickly load and visualise your data. This software is used by geospatial experts across the world and is the leading free and open source GIS software. If you want to use geospatial data and don’t know how to code, this is a great way to get started.
Python users should use GeoPandas for manipulating spatial objects; GeoPandas is the spatial version of Pandas so you should find it familiar. For mapping you should use matplotlib and for raster analysis we recommend rasterio. Installation of geospatial Python packages is slightly awkward so follow our installation guidance.
R users should use the sf package for manipulating spatial objects; sf integrates well with the tidyverse so should be comfortable for many R users. There are a number of mapping packages, we recommend tmap for its simplicity, but ggplot2, cartography and leaflet are also excellent options. For raster data we recommend using raster or stars. These packages are all available to install via the Artifactory, as usual. It’s worth mentioning that you might come across another package called sp - this is an old package which has been superseded by sf and you should avoid using it unless you have a specific reason to (for example, a few statistical packages still require sp objects).
Conclusion
Congratulations! You’ve reached the end of the course.
By now you should have a good understanding of:
- why geography is important for statistics
- what the GSS Geography policy is and why it matters
- geographic data
- types of geographic data
- plotting geographic data in the right place
- where to get geographic data
- GIS and geospatial analysis techniques
- what geospatial tools are available at ONS
If you’re interested and want to know more why not take our ‘Practical Geography for Statistics’ course, where you’ll learn more about applying geography for statistics.